HDWI Case Studies
We are testing HDWI for a multitude of fires and putting the results on this page along with a short synopsis of each event. Unlike the forecast plots, the obesrved traces you see are of the daily maximum HDWI from the closest lat/lon point in the CFSR or CFSv2 (depending on the date).
We are always looking for more cases to add. If you have historical fire cases that you're interested in examining with HDW, please send an email to Brian Potter and/or Alan Srock (info on the contact page). If you have additional information about the fire(s) you request, please let us know that too – there's no better help for us than someone with direct knowledge of the fire. We'll include your notes and an acknowledgement in our post.
List of Case Studies (sorted by state/province):
CA - Cedar Fire (2003)MI - Black River Falls Fire (2009)
MI - "Black Tuesday" Fires (1986)
MI - Duck Lake Fire (2012)
MI - Tower Lake Fire (1999)
MN - Pagami Creek Fire (2011)
NC - Evans Road Fire (2008)
NJ - Double Trouble Fire (2002)
NJ - Warren Grove Fire (2007)
OR - Tumblebug Fire (2009)
TX - Bastrop County Complex (2011)
TX - Matador Fire (2011)
WA - Thirtymile Fire (2001)
CA – Cedar Fire (2003)
Brief Summary
Acres burned: 280,278
Fire cause:
Fire start day: 23 October
Max spread day: 26 October
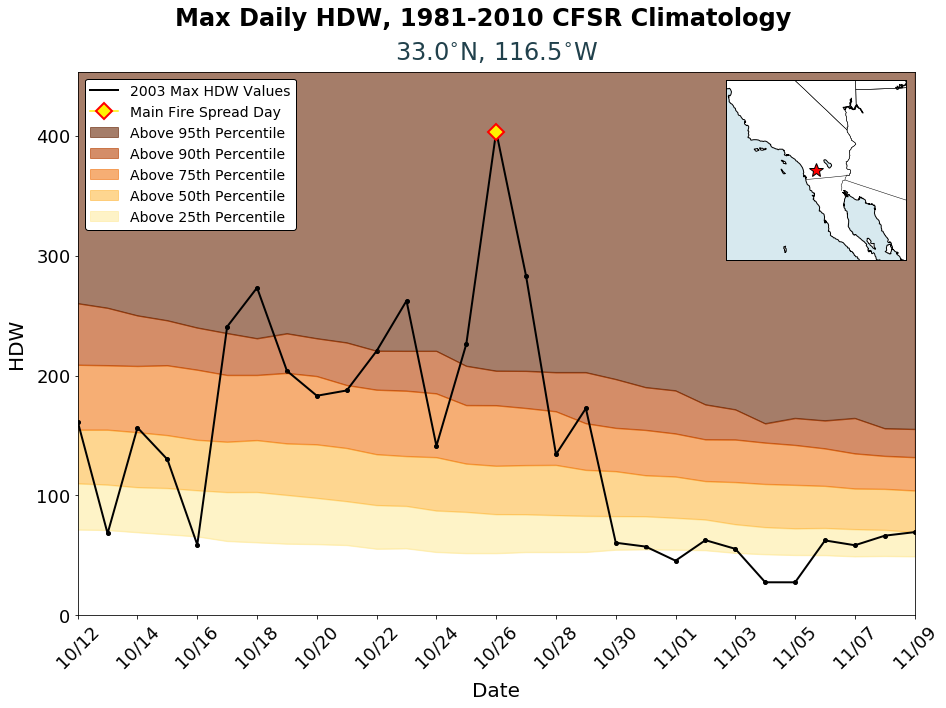
The 2003 Cedar Fire destroyed 355 structures and destroyed 151 vehicles in California (Bowman 2004). The fire started on 23 October and spread rapidly toward the west, with the largest spread day occurring on 26 October as a Santa Ana wind event developed (Raphael 2003). Since Santa Ana events are characterized by strong winds, high temperatures, and low moisture (large VPDs), HDWI should generally be high during Santa Ana events. However, the spatial scale of the Santa Ana must be large enough to be resolved in the CFSR dataset for our analysis to be able to diagnose the resulting atmospheric effects. The HDWI time series indicates a clear maximum on the day when the fire was most difficult to manage. Unlike most days when the maximum HDWI comes from 1800 or 0000 UTC (driven largely by daytime heating), the maximum for 26 October at this point occurred at 1200 UTC, when the Santa Ana event was strongest. It is therefore noteworthy that HDWI calculated using the 0.5-degree grid-spacing CFSR identified the key day when fire spread rapidly during a Santa Ana wind event.
(return to top)MI – Black River Falls Fire (2009)
Brief Summary
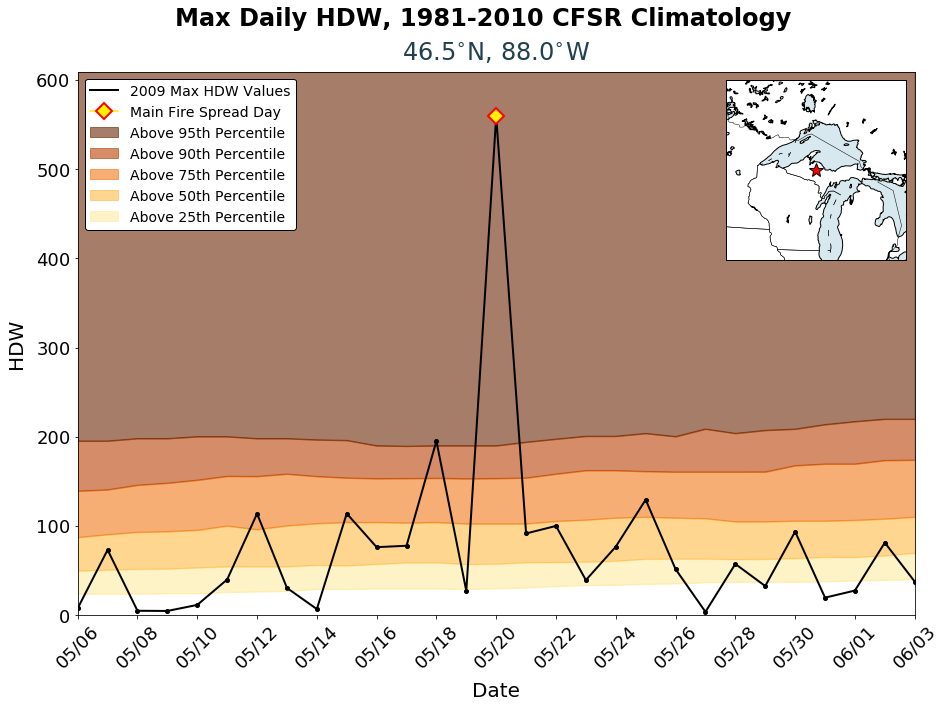
Acres burned: 806
Fire cause: Sparking power line
Fire start day: 20 May
Max spread day: 20 May
Description goes here.
(return to top)
MI – "Black Tuesday" Fires (1986)
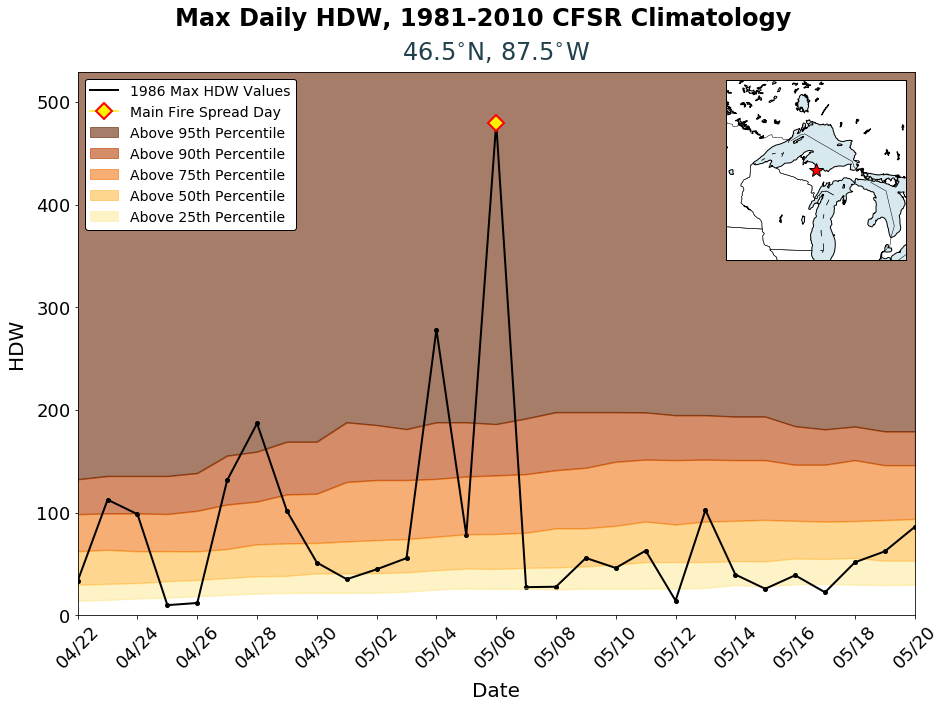
Brief Summary
Acres burned:
Fire cause:
Fire start day:
Max spread day:
Description goes here.
(return to top)
MI – Duck Lake Fire (2012)
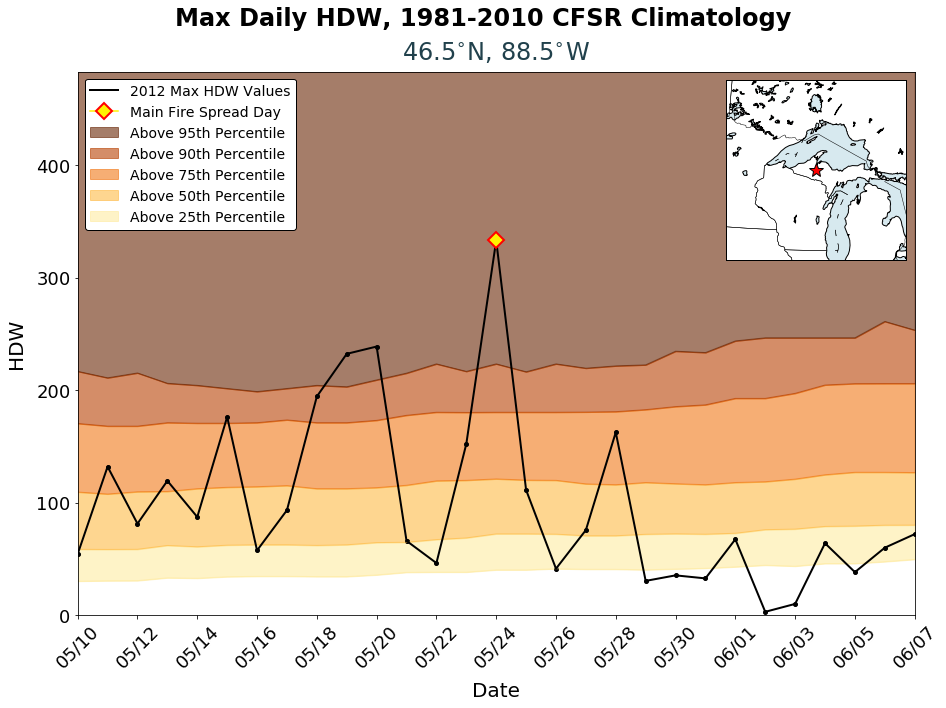
Brief Summary
Acres burned: 21,069
Fire cause: Lightning strike
Fire start day: 23 May
Max spread day: 24 May
Description goes here.
(return to top)
MI – Tower Lake Fire (1999)
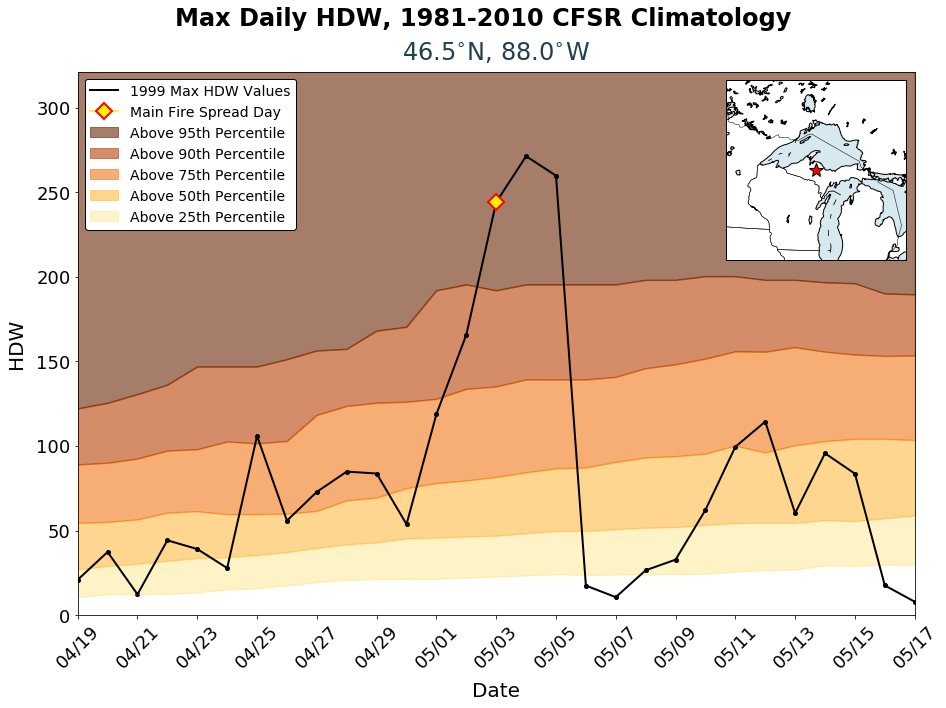
Brief Summary
Acres burned: 5,625
Fire cause:
Fire start day:
Max spread day:
Description goes here.
(return to top)
MN – Pagami Creek Fire (2011)
Brief Summary
Acres burned:
Fire cause: Lightning strike
Fire start day:
Max spread day: 12 September
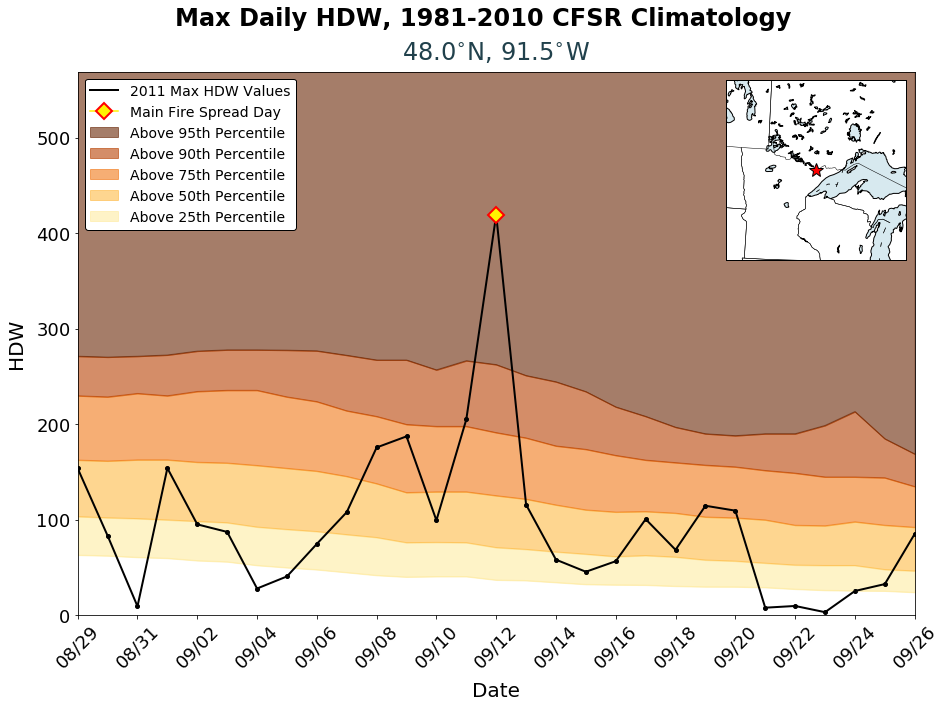
The Pagami Creek Fire occurred in the Boundary Waters Canoe Area Wilderness of the Superior National Forest in northern Minnesota. Most of the area burned on 12 September, and Sexton et al. (2012) identifies 12 September as the date on which the most “active fire behavior” was reported. The figure shows a time series of HDWI from 29 August through 26 September for the CFSR grid point closest to the fire location. The time series indicates that HDWI spiked on 12 September, so a daily trace of HDWI identified the date on which the most active fire behavior occurred. This indicates that synoptic and meso-alpha scale weather was at least partially responsible for the active fire behavior observed on 12 September.
(return to top)NC – Evans Road Fire (2008)
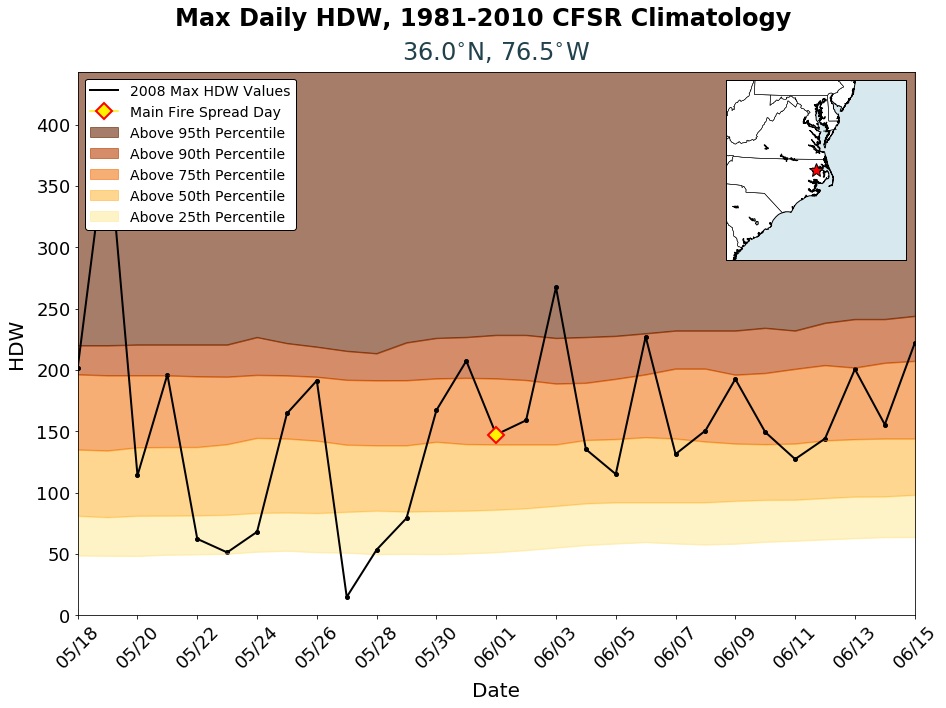
Brief Summary
Acres burned: 41,534
Fire cause: Lightning strike
Fire start day: 1 June
Max spread day: 1 June
Description goes here.
(return to top)
NJ – Double Trouble Fire (2002)
Brief Summary
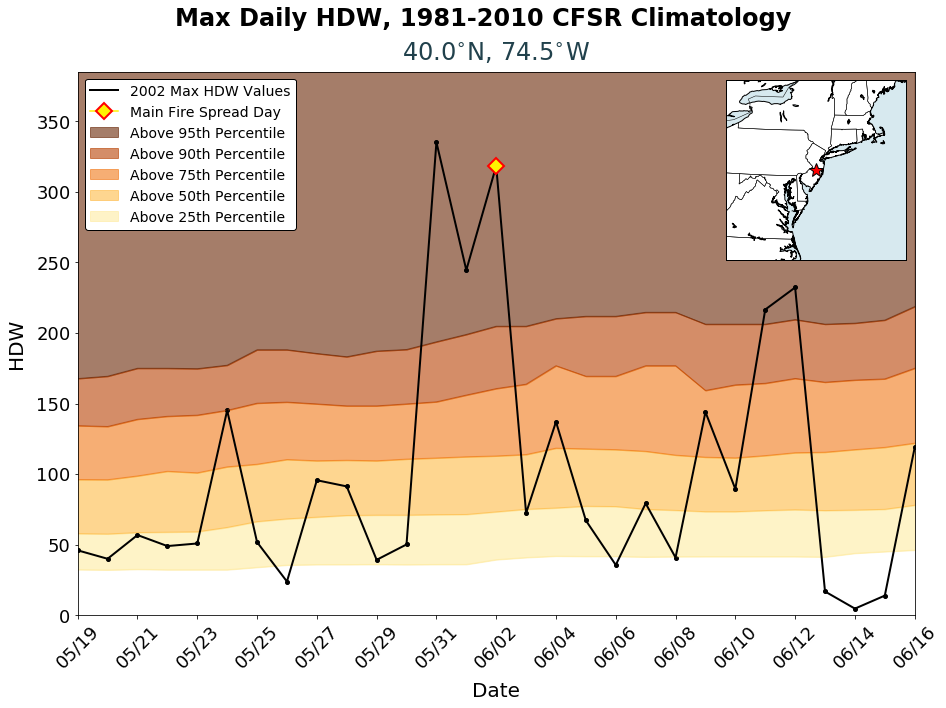
Acres burned: 1,300
Fire cause:
Fire start day: 2 June
Max spread day: 2 June
The Double Trouble Fire was a 1,300-acre, single-day event that occurred on 2 June near Beachwood, NJ (Kaplan et al. 2008; Charney and Keyser 2010). The HDWI time series indicates that, for the time period indicated in the figure, HDWI was anomalously high on 2 June. The analysis also indicates that HDWI was even higher on 31 May, two days earlier. Since there was no fire on that day at this location, it is not possible to state whether the higher HDWI value on 31 May would have corresponded to a day on which more active fire behavior occurred. This analysis suggests that HDWI might have some value in identifying days where fires that were started (prescribed or otherwise) have the potential to become difficult to manage.
(return to top)NJ – Warren Grove Fire (2007)
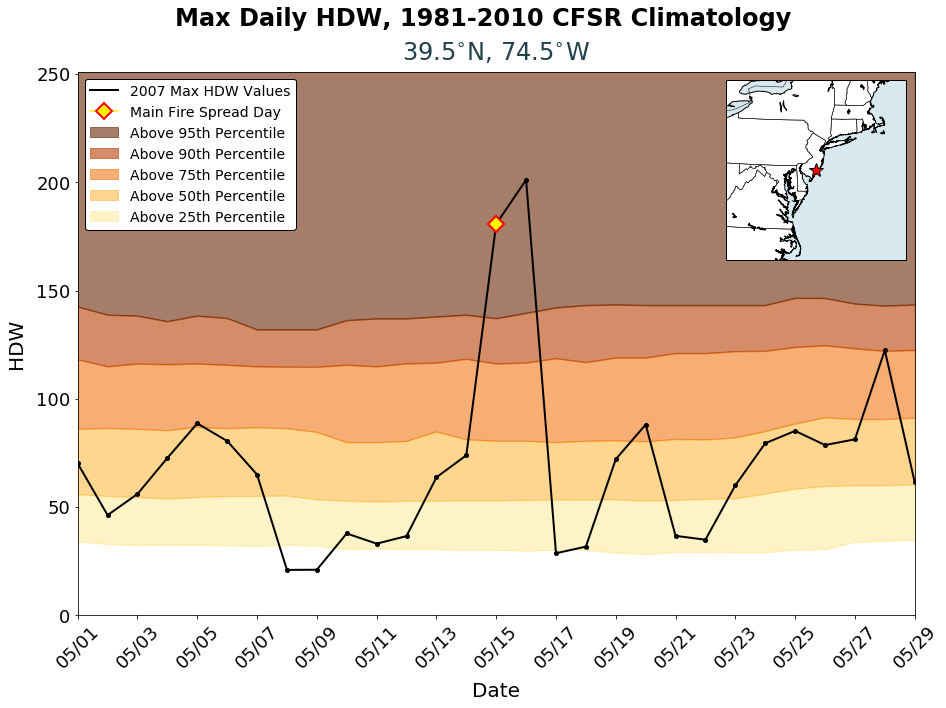
Brief Summary
Acres burned: 17,270
Fire cause: Military Flare
Fire start day: 15 May
Max spread day: 15 May
Description goes here.
(return to top)
OR – Tumblebug Fire (2009)
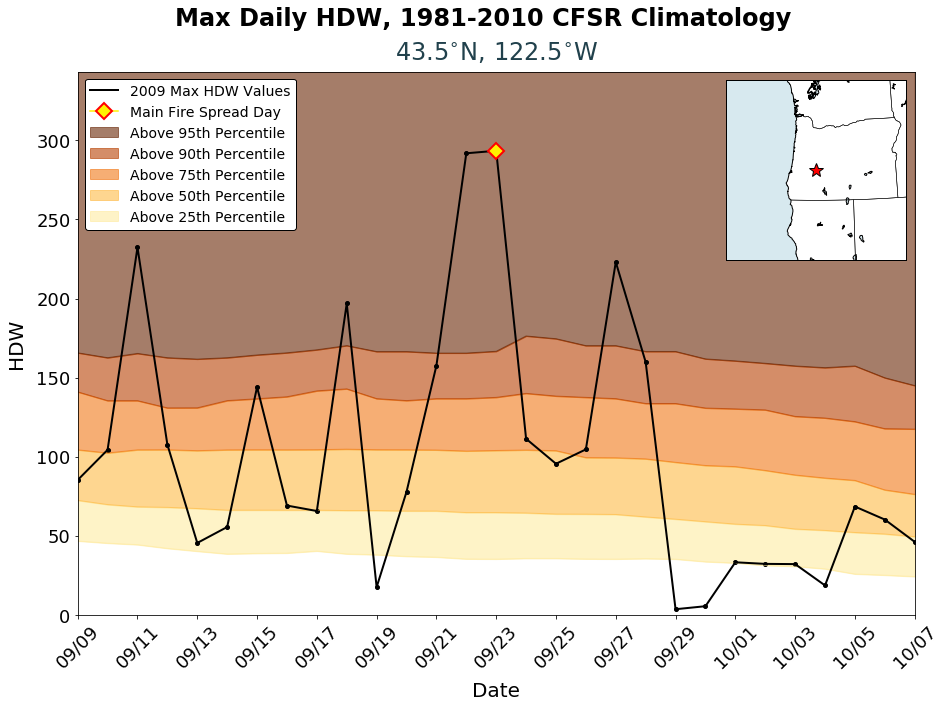
Brief Summary
Acres burned:
Fire cause:
Fire start day:
Max spread day:
Description goes here.
(return to top)
TX – Bastrop County Complex (2011)
Brief Summary
Acres burned: 34,356
Fire cause:
Fire start day: 4 September
Max spread day: 4 September
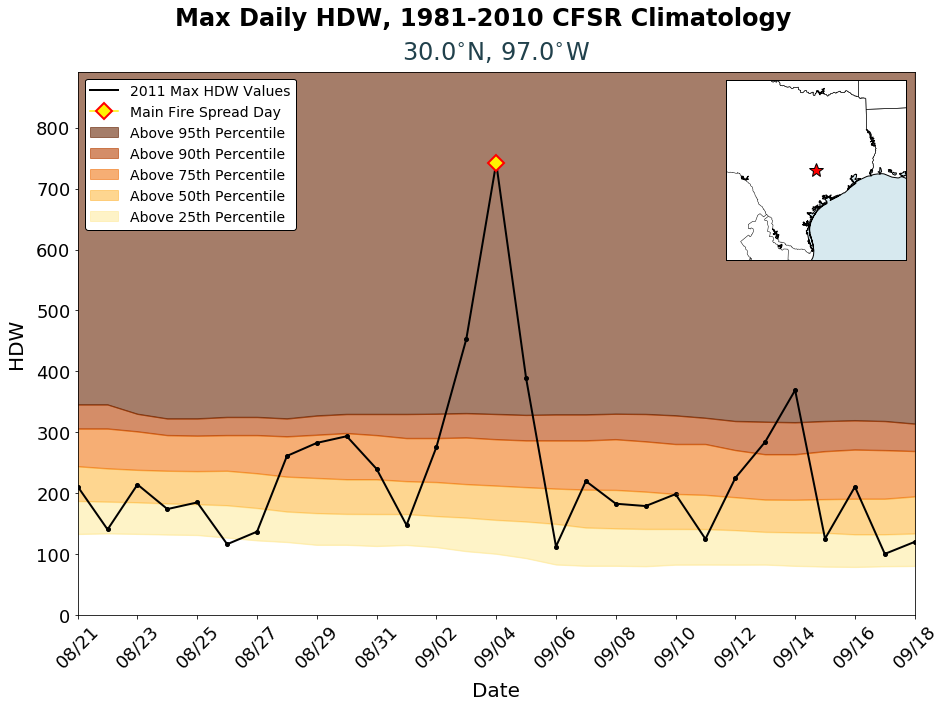
The Bastrop County Complex (2011) was a group of fires that occurred near Bastrop, TX (Huffman and Saginor 2012, Rissel and Ridenour 2013). The collection of fires destroyed 1799 structures and caused two fatalities. The fires started on 4 September, which was also the day on which the most active fire behavior was reported, the largest area was burned, and the day on which the fires were most difficult to manage. The figure shows the time series of HDWI from 21 August through 18 September, with a clear maximum on 4 September. This analysis shows that HDWI also can identify days where an initiating fire may spread rapidly due to large-scale weather conditions.
(return to top)TX – Matador Fire (2011)
Brief Summary
Acres burned:
Fire cause:
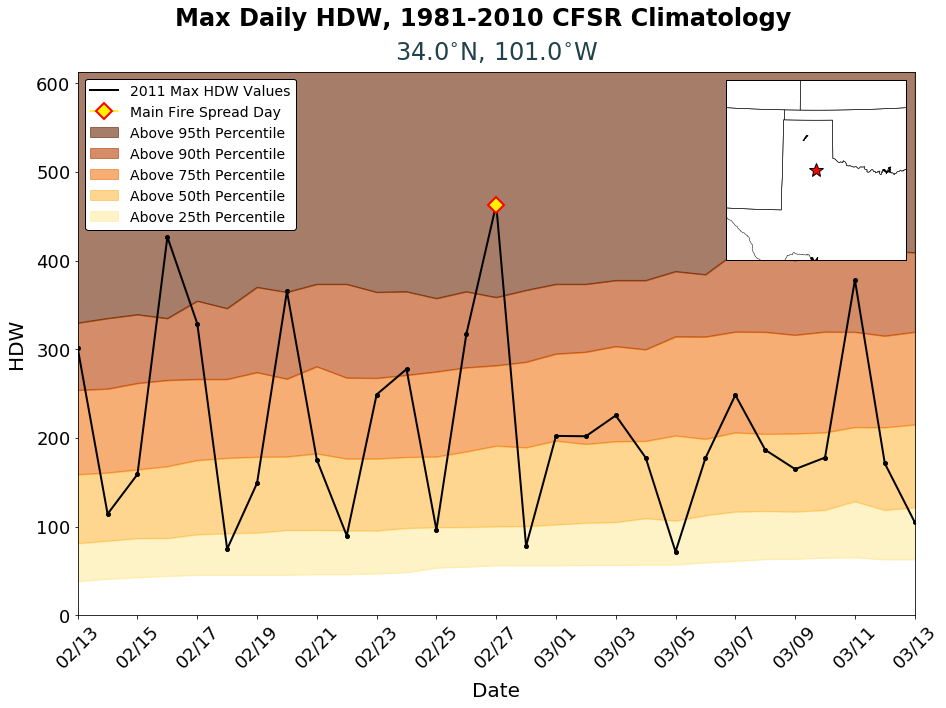
Fire start day: 27 February
Max spread day: 27 February
Description goes here.
(return to top)
WA – Thirtymile Fire (2001)
Brief Summary
Acres burned: 9,300
Fire cause:
Fire start day: 9 July
Max spread day:
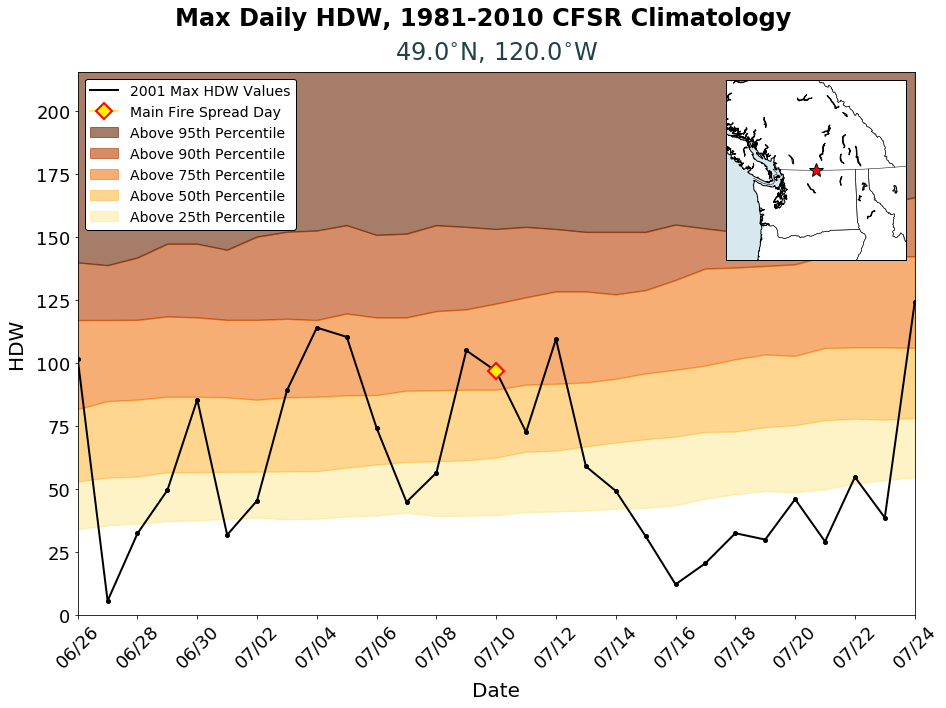
The Thirtymile Fire (2001) occurred 30 miles north of Winthrop, WA, in the Chewuch River Canyon (Furnish et al. 2001). The fire started on 9 July, burned 9,300 acres, and was responsible for the deaths of four fire-suppression personnel on 10 July as “severe” fire behavior and very hot and dry conditions were observed. Unlike the previous cases, HDWI is not substantially higher on 10 July than on other days in the time series. While HDWI on 10 July is higher than the average in the 29-day period shown, there are five other days with higher values.
We speculate that HDWI is not particularly high on 10 July because the meteorological conditions that contributed to the fatalities were driven primarily by flows tied to the local terrain – features the CFSR would be incapable of resolving. We choose to present this case as an example of how HDWI calculated from larger-scale data like the CFSR can fail to identify significant events if the fire behavior is driven by smaller-scale weather, fuel, and/or topography effects. HDWI (and any other fire-weather index calculated using larger-scale meteorological data) should be interpreted with caution in complex terrain.
(return to top)